Exam - Wed 08, Jun 2022
Scientific Programming - Data Science Master @ University of Trento
Download exercises and solutions
A. Trans-Atlantic Slave Trade
Open Jupyter and start editing this notebook exam-2022-06-08.ipynb. You will analyze voyages of slaves from Africa to the America of two centuries ago.
NOTICE: this part of the exam was ported to softpython website
There you can find a more curated version (notice it may be longer than here)
Data provider: The Trans-Atlantic Slave Trade Database. 2020. SlaveVoyages. https://www.slavevoyages.org. You are enouraged to explore the dataset with the very interesting online tool they built, in particular check out the Maps and Timelapse tabs.
Data license:
Historical data: The Trans-Atlantic Slave Trade Database. 2020. SlaveVoyages. https://www.slavevoyages.org (accessed June 9, 2020). License: Public domain (use restrictions do not apply).
Imputed data: Estimates. 2020. SlaveVoyages. https://slavevoyages.org/assessment/estimates (accessed June 9, 2020). License: Creative Commons Attribution-Noncommercial 3.0 United States License.
A1 read_trade
Each line in slave-trade.csv represents a ship voyage from a purchase place to a landing place. Parse it with a csv reader and output a list of dictionaries, one per voyage according to the output excerpt.
Each ship has a nation flag
NATINIMPEach voyage has purchase place code
MJBYPTIMPand a landing place codeMJSLPTIMPwith five digits formatxyzvtthat indicate a specific town: you MUST save more generic codes of the formxyz00which indicate broader regions.WARNING 1: convert to int only
VOYAGEIDandYEARAM, leaveMJBYPTIMPandMJSLPTIMPas stringsWARNING 2: some codes in
slave-trade.csvhave a space instead of a number, in those cases save code00000
[2]:
import pandas as pd
import numpy as np
df = pd.read_csv('slave-trade.csv', encoding='UTF-8')
df[df.VOYAGEID.isin([1, 2024, 2393, 4190])]
[2]:
| VOYAGEID | YEARAM | NATINIMP | MJBYPTIMP | MJSLPTIMP | |
|---|---|---|---|---|---|
| 0 | 1 | 1817 | Portugal/Brazil | 60820 | 50299 |
| 2000 | 2024 | 1840 | U.S.A. | 60615 | 31399 |
| 2361 | 2393 | 1829 | Spain/Uruguay | 60212 | |
| 4000 | 4190 | 1854 | U.S.A. | 60515 | 31301 |
Region labels: For each location you need to also save its label, which you can find in separate file region-codes.csv (load the file with a csv reader)
WARNING 1: in
region-codes.csvthere are only codes in formatxyz00WARNING 2: some region codes are missing, in those cases place label
'unknown'
[3]:
import pandas as pd
dfr = pd.read_csv('region-codes.csv', encoding='UTF-8', dtype=str)
dfr[dfr.Value.isin(['60800','60600','31300','50200','60500'])]
[3]:
| Value | Region | |
|---|---|---|
| 47 | 31300 | Cuba |
| 84 | 50200 | Bahia |
| 92 | 60500 | Bight of Benin |
| 93 | 60600 | Bight of Biafra and Gulf of Guinea islands |
| 95 | 60800 | Southeast Africa and Indian Ocean islands |
Output excerpt: (for full output see expected_db.py)
>>> read_voyages('slave-trade.csv', 'region-codes.csv')
[
{'flag': 'Portugal/Brazil',
 'id': 1,
 'landing_id': '50200',
 'landing_label': 'Bahia',
 'purchase_id': '60800',
 'purchase_label': 'Southeast Africa and Indian Ocean islands',
 'year': 1817},
{'flag': 'U.S.A.',
 'id': 2024,
 'landing_id': '31300',
 'landing_label': 'Cuba',
 'purchase_id': '60600',
 'purchase_label': 'Bight of Biafra and Gulf of Guinea islands',
 'year': 1840},
{'flag': 'Spain/Uruguay',
 'id': 2393,
 'landing_id': '00000',
 'landing_label': 'unknown',
 'purchase_id': '60200',
 'purchase_label': 'Sierra Leone',
 'year': 1829},
{'flag': 'U.S.A.',
 'id': 4190,
 'landing_id': '31300',
 'landing_label': 'Cuba',
 'purchase_id': '60500',
 'purchase_label': 'Bight of Benin',
 'year': 1854},
  .
  .
]
[4]:
import csv

def read_voyages(slave_trade_csv, region_codes_csv):
    raise Exception('TODO IMPLEMENT ME !')

voyages_db = read_voyages('slave-trade.csv', 'region-codes.csv')

print('OUTPUT EXCERPT:')
from pprint import pformat
print('[\n' +',\n'.join([pformat(voyages_db[vid]) for vid in [0,2000,2361, 4000]]) + ',\n  .\n  .\n]')
[5]:
# TESTING
from pprint import pformat; from expected_db import expected_db
for i in range(0, len(expected_db)):
    if expected_db[i] != voyages_db[i]:
        print('\nERROR at index', i, ':')
        print('  ACTUAL:\n', pformat(voyages_db[i]))
        print('  EXPECTED:\n', pformat(expected_db[i]))
        break
if len(voyages_db) != len(expected_db):
    print("ERROR: Different lengths!  voyages_db:", len(voyages_db), "   expected_db:", len(expected_db))
A2 Deportation
For each link purchase -> landing place, count in how many voyages it was present, then draw result in networkx.
as edge
weightuse a normalized value from 0.0 to 1.0 (maximal count found in the graph)show only edges with weight greater or equal to
min_weightto display the graph from right to left, set
G.graph['graph']= {'rankdir':'RL'}for networkx attributes see this example, make sure to display edges proportionally to the weight
>>> show_deportation(voyages_db, 0.09)
COUNTS EXCERPT SOLUTION:
{
  ('60800', '50200') : 48,
  ('60700', '50200') : 1301,
  ('60700', '50400') : 2770,
  ('60800', '50400') : 443,
  ('60900', '50400') : 196,
    .
}


[6]:
import networkx as nx
import sys
sys.path.append('../../')
from sciprog import draw_nx

def show_deportation(voyages, min_weight):
    raise Exception('TODO IMPLEMENT ME !')
show_deportation(voyages_db, 0.09)
#show_deportation(voyages_db, 0.06)
A3 The time to stop
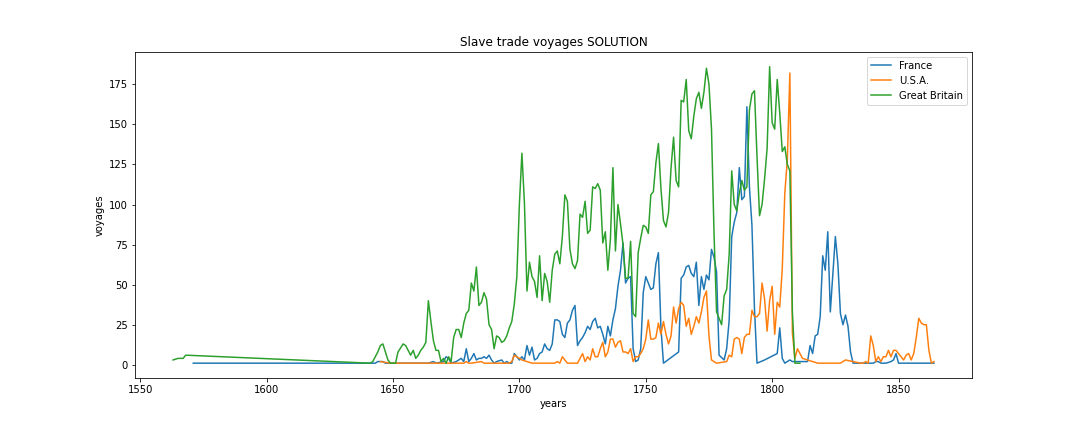
Given a nation flag, plot inside draw_time the number of voyages per year done by ships belonging to that flag. DO NOT call plt.show nor plt.figure. We show some counts example but to calculate the data feel free to use any method you want. To associate a plot to a label, use i.e. plt.plot(xs, ys, label='France')
>>> fig = plt.figure(figsize=(15,6))
>>> draw_time(voyages_db, 'France')
>>> draw_time(voyages_db, 'U.S.A.')
>>> draw_time(voyages_db, 'Great Britain')
>>> plt.legend()
>>> plt.show()
France COUNTS EXCERPT SOLUTION:
{
        1816:7,
       1819:30,
       1821:59,
       .
}
U.S.A. COUNTS EXCERPT SOLUTION:
{
        1821:1,
        1827:1,
        1837:2,
       .
}
Great Britain COUNTS EXCERPT SOLUTION:
{       1810:1,
        1809:1,
        1811:1,
       .
}

[7]:
%matplotlib inline
import matplotlib.pyplot as plt

def draw_time(voyages, flag):
    raise Exception('TODO IMPLEMENT ME !')

fig = plt.figure(figsize=(15,6))
draw_time(voyages_db, 'France')
draw_time(voyages_db, 'U.S.A.')
draw_time(voyages_db, 'Great Britain')
plt.legend()

plt.show()
B1.1 Theory
Write the solution in separate ``theory.txt`` file. Given a list \(L\) of \(n\) elements, please compute the asymptotic computational complexity of the \(myFun\) function, explaining your reasoning.
[8]:
def myFun(L):
    T = []
    N = len(L)
    for i in range(N//4):
        k = 0
        tmp = 0
        while k < 4:
            tmp += L[i]*k
            k = k + 1
        T.insert(0,tmp)

    return(T)
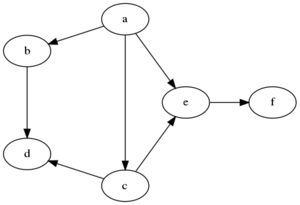
B1.2 BFS
Describe what a BFS visit of a graph is. Please provide the order of visited nodes of a possible BFS visit on the following graph (starting from node ‘a’):
B2 BinaryTree is_heap_stack
Open Visual Studio Code and start editing the folder on your desktop. Implement this:
def is_heap_stack(self):
    """ A tree is a min heap if each node data is less or equal than its children data.
        RETURN True if the tree is a min heap, False otherwise

        - DO *NOT* use recursion
        - implement it with a while and a stack (as a python list)
        - MUST run in O(n), where n is the tree size
    """
Testing: python3 -m unittest bin_tree_test
[10]:
from bin_tree_test import bt
from bin_tree_sol import *
t = bt(7,
        bt(9,
                bt(10,
                        bt(40)),
                bt(14)),
        bt(20,
                None,
                bt(30,
                        bt(50),
                        bt(90))))

t.is_heap_stack()
[10]:
True
[11]:
t = bt(7,
        bt(9,
                bt(10,
                        bt(40)),
                bt(14)),
        bt(20,
                None,
                bt(30,
                        bt(11),
                        bt(90))))
t.is_heap_stack()
[11]:
False
B3 GenericTree rightmost

In the example above, the rightmost branch of a is given by the node sequence a,d,n. Implement this method:
def rightmost(self):
    """ RETURN a list containing the *data* of the nodes
        in the *rightmost* branch of the tree.
Testing: python3 -m unittest gen_tree_test.RightmostTest
[12]:
from gen_tree_test import gt
t = gt('a',
           gt('b'),
           gt('c',
                  gt('e')),
           gt('d',
                  gt('f'),
                  gt('g',
                         gt('h'),
                         gt('i'))))
t.rightmost()
[12]:
['a', 'd', 'g', 'i']
[ ]: